The month of May marks the one-year anniversary since our portfolios were opened for investment and we’re pleased with the performance during the first year.
Over the 12 months to 30th April 2015, each of our 5 portfolios generated over 10.4% in total returns. The more conservative portfolios performed almost as well as the higher growth options due to the strong performance from Australian bonds over the year. All of the portfolios delivered a combination of capital return and distribution (dividend) income.
Stockspot portfolios: 1st May 2014 – 30th April 2015
| Total return | Distributions | |
| Topaz | 11.93% | 4.05% |
| Emerald | 10.58% | 4.00% |
| Turquoise | 10.44% | 3.76% |
| Sapphire | 10.86% | 3.49% |
| Amethyst | 11.14% | 3.24% |
Total return after ETF and management fees
Diversification in action
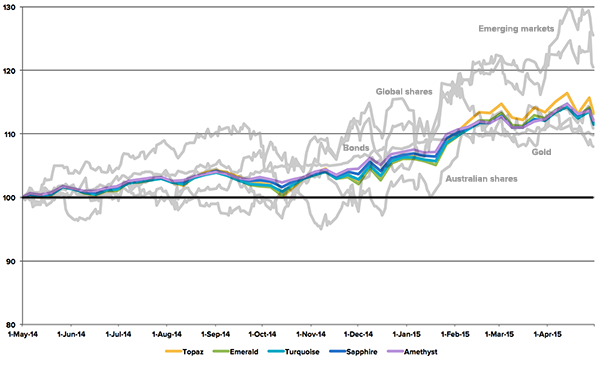
The diversification of our portfolios across different assets and countries has smoothed out short-term market movements so that our clients have been less exposed to the dramatic ups-and-downs of individual asset classes.
As you can see, consistently predicting the best and worst performing asset class is nearly impossible since it rotates randomly each month.
| Best performer | Worst performer | |
| May-14 | Emerging markets | Gold |
| Jun-14 | Gold | Australian shares |
| Jul-14 | Australian shares | Gold |
| Aug-14 | Emerging markets | Gold |
| Sep-14 | Global shares | Australian shares |
| Oct-14 | Australian shares | Gold |
| Nov-14 | Global shares | Australian shares |
| Dec-14 | Gold | Emerging markets |
| Jan-15 | Gold | Bonds |
| Feb-15 | Australian shares | Gold |
| Mar-15 | Bonds | Australian shares |
| Apr-15 | Emerging markets | Gold |
Instead of trying to pick short-term winners, we spread investments across many assets which helps to reduce risk without negatively impacting returns. Spreading investments in this way has provided a much smoother path for our clients over the past year.
Our 5 portfolios, represented in the respective colours below, have enjoyed significantly smaller rises and falls over the last 12 months compared to the individual assets they are invested in.

Growth of ETFs
Exchange traded funds (ETFs), which make up the Stockspot portfolios, have continued to grow in popularity with total funds invested in ASX-listed ETFs ballooning by 70% to $17.8 billion over the past year.
The flood of money flowing into ETFs has continued as investors search for better returns than money in the bank with the current low interest rate.
ETFs that invests in global assets contributed much of the growth this year as Australians looked offshore for better returns. Within our portfolios, the emerging markets ETF returned 25.38% and global shares ETF returned 20.69%. Currency movements played a large role in ETF returns over the past year with unhedged ETFs performing better than hedged ETFs due to the fall in the Australian dollar (AUD).
Self-directed investors and Self Managed Super Funds (SMSFs) are still the biggest users of ETFs, accounting for more than half of the volume traded.
Looking ahead
We are constantly reviewing the ETF universe looking for opportunities to improve our portfolios by reducing risk, maximising return opportunities and minimising fees. We will also be releasing our Inaugural ETF Report next month which will be available to our clients and newsletter subscribers.
Find out how Stockspot makes it easy to grow your wealth and invest in your future.
Past performance of financial products is no assurance of future performance. Actual performance of your portfolio may vary from our published returns due to the timing of investments, rebalancing and your fee tier. The Stockspot indices have been published since July 2013 and open for investment since May 2014.


