In this article we answer five common questions about Stockspot portfolio returns.
Why is my return different to what I see in the newsletter?
In our newsletter and on our website we use time weighted returns. This is the most common way for fund managers to measure performance. It assumes you invested a fixed amount. It also assume you held it for a period of time like one year, three years or five years.
There are four main reasons your own returns won’t exactly match our published time weighted returns:
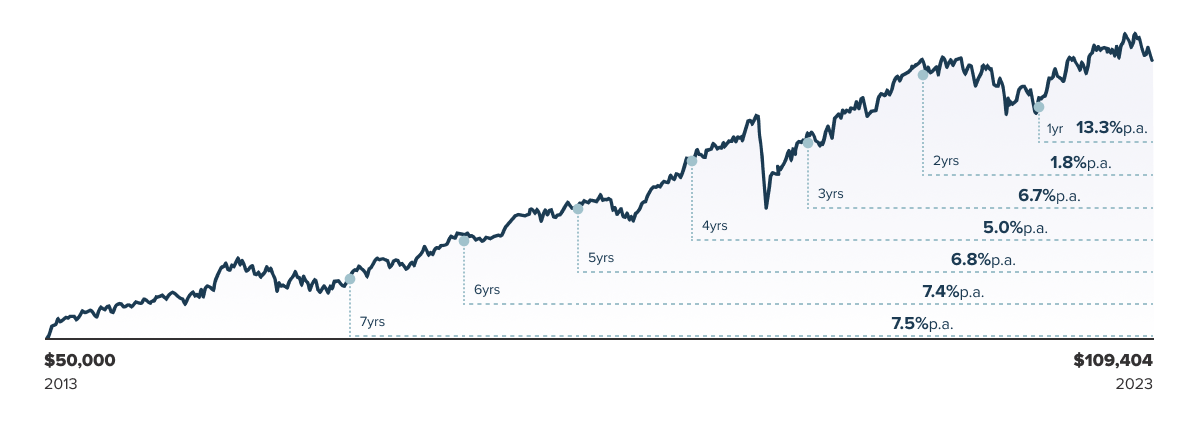
- The timing of when you invested. Our one-year return is based on the assumption that the entire investment was made exactly one year ago. A difference of even a day or a week could lead to significantly different outcomes. Returns are not evenly distributed throughout the year. For instance, if you have been invested for only 11 months, it’s possible that you have missed some of the returns—or conversely, gained additional returns. Generally, the longer your investment period, the more your return is likely to align with the published figures. Refer to the chart below for a visual representation of how returns are measured.

The returns shown are after-fees as of 30 September 2023 and are based on the performance of the Stockspot Topaz portfolio.
- If you made multiple investments. We use the industry standard method of showing your total return as a percentage of your current investment balance. This means your returns might be understated if you make regular deposits.
For example, Kristy deposits $10,000 on 1 January, 2021. The return on her initial investment is $1,000 or 10% one year later by 1 January, 2022. On 2 January, 2022 Kristy deposited another $10,000. The total return on her dashboard will now show $1,000 on $20,000 or 5% which is understated.
That’s where the money-weighted return or annual % return comes in handy. It looks at each of your deposits and withdrawals. It shows your average annual return on the money that was invested at any point in time. Stockspot only shows your money-weighted return after you’ve been invested for at least one year. The reason for this is that annualising returns for shorter periods of time can be misleading. Stockspot prefers not to do it until your average years invested is at least one year.
Using the example above, the annual % return on Kristy’s dashboard will still show 10% on 2 January, 2022. The initial $10,000 has been invested for one year and the second $10,000 has only been invested for one day. Therefore the average amount invested is still about $10,000.
- If you have dividends owned but not received yet. ETFs typically go ‘ex distribution’ a few weeks before the dividends are paid as cash. Our dashboard shows your returns on an accrual basis. If you’re owed dividends these are displayed even if you haven’t received the cash yet.
- If your portfolio is less than $10,000 and we’re gradually phasing in the ETFs for your portfolio.
Next we explain how we account for franking credits and other non-cash sources of income in your total return.
More information on how we calculate returns can be found in our article on how Stockspot calculates returns. In this article we explain the difference between time weighted returns, total return percentages and money-weighted annual percentages.
Why does my portfolio value not add up to my deposits + returns + interest – fees?
There are two potential reasons for this:
- Distributions (dividends) owed but not received yet. ETFs typically go ‘ex distribution’ a few weeks before the dividends are paid as cash. Our dashboard shows your returns on an accrual basis. If you’re owed dividends these are displayed even if you haven’t received the cash yet. Don’t worry, you’ll receive the dividends cash soon.
- Non cash sources of income. Some of the ETFs you’re investing in distribute non-cash income such as franking credits and foreign tax credits. These are captured in your return. As they are not received as cash you’re not seeing them as a deposit into your account. Instead you’ll need to claim them on your tax return. Stockspot will help provide all of this information at tax time. If you want to learn more we’ve written two helpful articles:
My returns are negative, should I be worried? What should I do?
It can be unnerving to see short term dips in the value of your portfolio. Especially in your first year of investing. We get it, staring down negative returns is rough. You start questioning yourself – have I made the right decision?
Rest assured, it’s very normal to see your portfolio’s returns being up or down during the first year. It’s only over longer periods that you’re likely to see your returns start to converge with the long term trend.
Put in perspective, this table shows the chance of achieving a positive return from investing into the Australian sharemarket.
As you can see, the longer you invest the better your chance of a positive result. This is why one of our investment principles is Time in the market, not timing the market.
We recommend all Stockspot clients to keep a lens on the longer term. And stick with investment plans even though short term returns can be negative. Stockspot portfolios are designed for an investment timeframe of at least three to seven years. This is why it’s important to have more time in the market to give your portfolio a chance to grow.
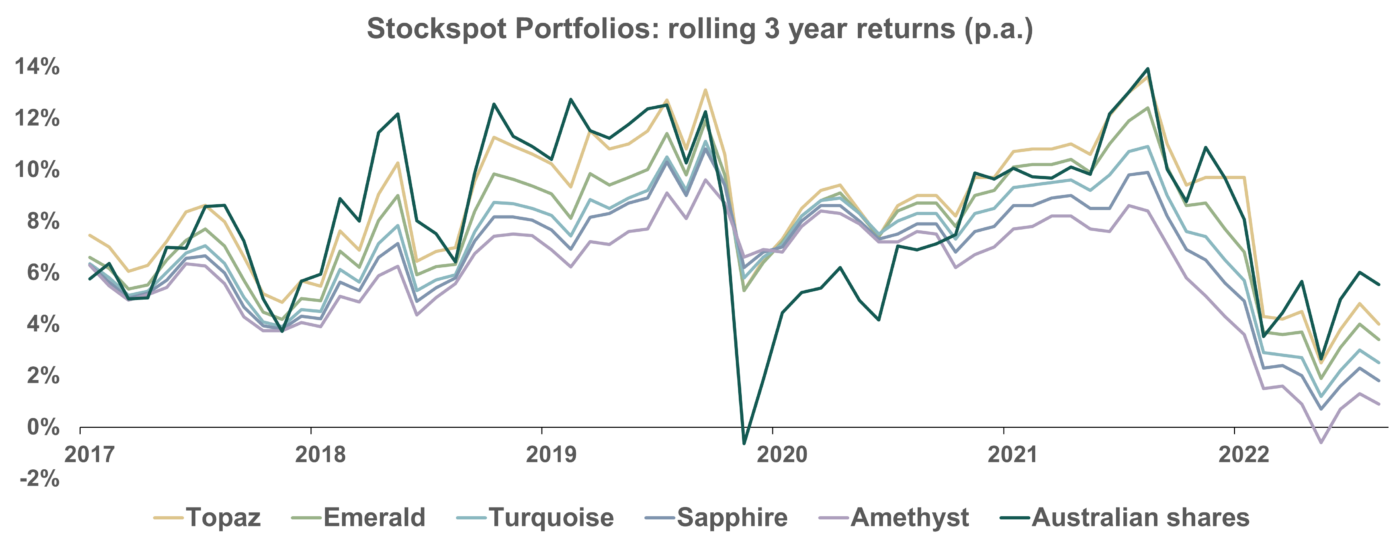
The following chart shows the trailing three-year returns of our portfolios which have primarily been positive since Stockspot was founded. More importantly, our portfolios have been much less risky compared to only owning Australian shares. These shares have experienced more variable three-year returns (including some negative periods).

All investing involves some risk. Ensure you’re well diversified across different assets and have a long-term horizon. This will help ensure you’ve got a good chance of a achieving a positive return and hitting your financial goals.
Should I change my strategy to target better returns?
There are some good reasons and not so good reasons for changing your investment strategy.
Good reasons
Whenever your personal circumstances change, such as your goals, investment timeframe or comfort with risk, you should review your investment profile to make sure it’s still appropriate for you. We also do this annually for all clients to ensure clients are in a strategy that matches their goals, timeframe and capacity to take risk. If your time horizon has become longer, for example, it might make sense to switch to a strategy with more growth assets.
Not so good reasons
It can be tempting to change strategies when something else is performing better. This isn’t a good reason to change strategies because it’s likely to lead you to take more risk than you should be. Plus when you do change there’s a good chance it will be at the worst possible time.
You’ll know this feeling when you’re tempted to change lanes as you’re stuck in traffic. (Like in the movie Office Space.) You see another lane moving faster. As soon as you change lanes the lane you’ve just come from starts moving and you’re left behind.
If you’re thinking of changing strategies because another portfolio has had higher returns, our advice would be to try and stick in your lane. Don’t worry, the traffic will start moving again soon and changing lanes probably won’t get you there faster.
Can I remove one of the assets in my portfolio that has negative returns, or add more money to an asset that has performed well?
The Stockspot portfolios include a mix of different investments like shares, bonds, and gold. These are designed to grow and protect your wealth over the long run.
Each of the Stockspot portfolios has pre-set target weights for each of the investments within the portfolio (shares, bonds, gold). These weights have been carefully crafted to ensure that the portfolios are able to perform well in different economic environments.
For example:
- Australian shares tend to do well during periods of high growth and high inflation.
- Global shares do well during high growth and low inflation.
- Government bonds do well during low growth and low inflation, and
- Gold does well during low growth and high inflation.
Nobody knows what environment we’re about to go into so it’s handy to have an allocation to different types of investments so you can ride the economic cycle more smoothly.
Although it’s tempting to buy more of an investment that’s performing well, it’s usually the time where you should instead be selling. Buying after prices have already risen strongly or selling assets after they have already done poorly would lead to your portfolio becoming too risky and not performing well in certain environments. For example, we received lots of requests to remove gold from portfolios in 2015-2016. This was after it had already performed badly. Since then gold has been a great performer.
Avoid trying to time when to get in and out of particular assets. Stockspot’s optimised rebalancing is the best way to take advantage of an asset class that is performing well and becomes too overweight in your portfolio. When this happens we sell a small percentage of the investment, and reallocate the funds to an investment that has underperformed. This brings your portfolio back to its target weight and allows you to benefit as conditions change.
Think of it like farming – in any season you’re harvesting some crops and sowing some seeds.
When markets fell in early 2020 we rebalanced by harvesting some profits from gold and reinvested them into Australian shares (which had fallen 30%). Then in November 2020 we did the opposite by selling some Australian shares and buying some defensive assets.
An allocation to different assets and regular automated rebalancing will help your portfolio perform better across the different seasons of the market.


