There are several ways you can calculate investment returns.
Here are the 3 different methods we use at Stockspot and a few reasons why different return measures can be useful for different situations.
| Performance measure | Where will you see it? | Useful for |
| Time weighted return | Stockspot website and newsletter | Comparing Stockspot to other investments like a managed fund. |
| Total return | Client investment dashboard | Quickly understanding the total return you have made. |
| Money weighted annualised return | Client investment dashboard when you’ve invested in each asset for more than a year | Comparing Stockspot to other annualised returns like savings accounts. |
Starting with the basics: Time weighted returns
Where will you see it?
Since Stockspot has no control over when clients choose to deposit or withdraw their funds, time weighted returns is the most accurate way we can show our model portfolio returns over a period of time.
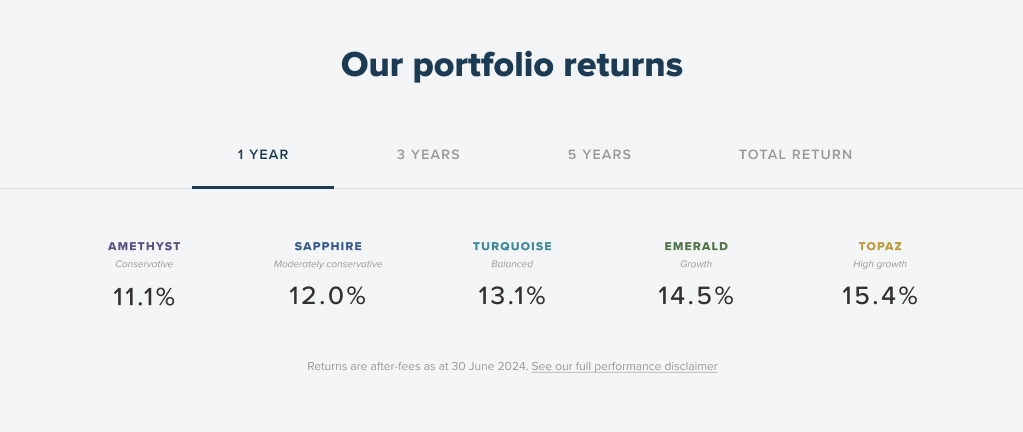
Whenever Stockspot reports on performance since inception or over a time period like 1, 3, 5 or even 10 years we use time weighted returns. e.g. on our website or in our newsletter like below.

How is it calculated?
To calculate time weighted return you need to know your starting portfolio value, your ending value and the time period. From this you can calculate the time weighted returns for that number of years as follows:
| Date | Portfolio value including distributions and fees |
| 30 June 2014 | $10,207.10 |
| 30 June 2015 | $10,952.22 |
| 30 June 2016 | $11,267.64 |
| 30 June 2017 | $12,012.43 |

Stockspot uses the compound time weighted return methodology, including the reinvestment of distributions but excluding individual tax.
What is it useful for?
Time weighted returns are useful when comparing Stockspot’s long term results to other investment options like growth or balanced funds.
Where does it fall short?
Time weighted returns assume that the entire investment was made at the start of the calculation period so this method may not be as useful for clients who invested mid way through a period or clients who are making regular deposits (dollar cost averaging) and want to see how the timing of their deposits impacted their returns. This is where total return and annualised return are more useful.
A more personalised approach: Total return
Where will you see it?
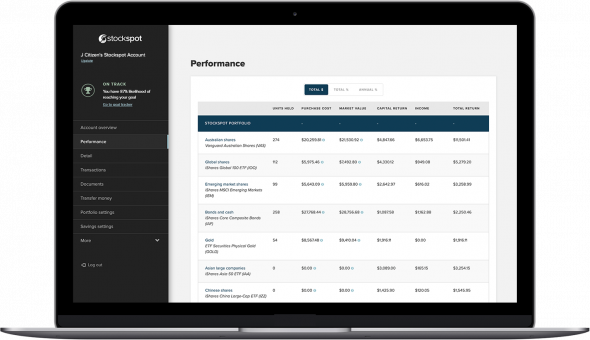
We display total return on the performance page of the Stockspot investment dashboard. This shows the return you’ve actually made on each investment and on your portfolio as a whole including distributions and fees. Total return is displayed in dollar terms and percentage terms and includes returns from any investment that have been sold.

How is it calculated?
Here’s how we would calculate total returns for a client who had invested $10,000 for 8 months.
| Investment amount | $10,000 |
| Investment period | 8 months |
| a. Capital growth | $258.40 |
| b. Distributions | $289.10 |
| c. Management fees | $13.20 |
| Total $ return (a+b-c) | $534.30 |
| Total % return | 5.34% |

What’s it good for?
Total return is a great way to see how much you’ve made in total including all capital returns, distributions and fees.
Where does it fall short?
Total percentage returns show your return as a percentage of the total amount you invested. This means that if you are gradually adding to your portfolio (dollar cost averaging), this figure will understate the return you’ve made on your average portfolio balance over the period you invested.
For example if you had only invested $5,000 for 7 months and then deposited another $5,000 for 1 month, it’s not really fair to calculate your return based on the full $10,000 since for most of the time you had only invested $5,000. Therefore your $534.30 return should really be compared to an investment of $5,000 for 7 months and $10,000 for 1 month. This is why we also display money-weighted annual percentage returns which account for when deposits were made.
See how hard your money is working for you: Money weighted annualised return
Where will you see it?
We display the money weighted annualised return on the performance page of the Stockspot investment dashboard once clients have been invested for more than 12 months in each investment and their portfolio as a whole.
Why don’t we display it for the first 12 months? The main reason is that this number isn’t very useful for the first year because it tends to extrapolate short term market moves. For example, a 1 week return of 2% would become annualised return of about 104% which clearly isn’t realistic. Once you’ve invested for more than 12 months an ‘annualised return’ makes more sense.

How is it calculated?
We calculate annualised returns using the ‘money-weighted’ return method. A money-weighted return considers the dates you made deposits and withdrawals to measure how hard your money is working for you. This method accounts for the timing of your cash in and out the portfolio and calculates your return in annual terms for a more relevant figure for long-term investors.
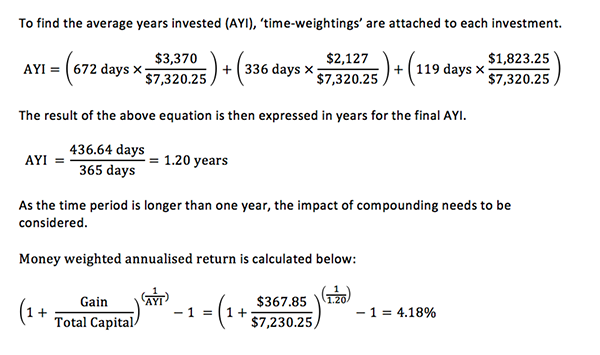
To calculate the annualised percentage returns, Stockspot weighs the amount of money invested by the length of time that each deposit has been invested. This determines the average years invested (AYI) for each dollar you’ve invested.
Here’s an example of money weighted returns where we have bought Australian shares ETF (VAS) for a client at 3 different points in time. To calculate this client’s money weighted annualised return we need to calculate their total capital gains and average investment period.
| Date | Investment | Average purchase cost | Total Cost |
| 28 August 2018 | Purchase 50 units of VAS (Australian shares) | $67.40 | $3,370.00 |
| 29 July 2019 | Purchase 30 units of VAS (Australian shares) | $70.90 | $2,127.00 |
| 3 March 2019 | Purchase 25 units of VAS (Australian shares) | $72.93 | $1,823.25 |
Capital gain = Market value – purchase cost
Purchase cost = $3,370 + $2,127 + $1,823.25 = $7,320.25
Market value: The last share price of VAS at 30 June 2017 was $73.22. Therefore the total market value of this client’s investment in VAS at 30/06/2017 was 105 x $73.22 = $7,688.10
Capital gain = $7,688.10 – $7,320.25 = $367.85

This example just shows how money-weighted annualised return is calculated for capital return part of the Australian shares return. This would also be calculated for the distributions part of the return, as well as for every other investment in the portfolio and for the portfolio as a whole.
What’s it good for?
The money-weighted annualised return is more helpful than the total return over longer periods of time and in the case when you want to know how much each dollar you have invested has returned per year compared to other ‘annualised’ figures like a savings account.
Where does it fall short?
This method also has some shortcomings, particularly when the amount you have invested has large changes over time (from topping up or selling) which can lead to your average years invested (AYI) becoming unrealistic.
Large top up example: if you invest $10,000 for 11 months and then deposit an additional $90,000 for 1 month, your average years invested (AYI) for the $100,000 total is only 2 months even though you have been invested for 1 year.
Large sale example: if you invest $100,000 for 11 months and then sell $90,000 for 1 month, your average years invested (AYI) for the remaining $10,000 is 9 years even though you have been invested for 1 year.
To avoid showing unrealistic returns caused by large purchases or sales Stockspot only displays money weighted annualised returns when your average years invested (AYI) is more than 1 year and not substantially different from your actual investment period.
In summary
As you can see, there are several way of working out investment returns. We try to provide the most relevant figure for each situation to help clients keep track of how they are performing.
Find out how Stockspot makes it easy to grow your wealth and invest in your future.


