Content
Summary of ETF sector growth
Australian investors are waking up to the benefits of asset and country diversification with large growth in Bond ETFs and Global Shares ETFs.
Increases in ETF FUM can come from two sources:
- An increase in the price of the ETF and its underlying holdings
- New investors moving their money into the ETF (i.e. flows)
Australian shares vs global shares
Global share ETFs reached FUM of $21b compared to $17b in Australian Share ETFs. Global share ETFs have had a compound annual growth rate of 43% over the last 5 years as more retail investors look to compliment their Australian shares with overseas companies.
Australian Share ETFs have lagged primarily due to lower levels of money flowing in, slightly lower performance than the global peers, and a larger number of new global share ETF products now available on the market.
ETF sector flows
More Australian investors are using bond ETFs as their defensive cushion against share market volatility. Bond & Cash ETFs FUM almost doubled (+46%), with nearly the entire increase due to the large level of new investor money inflows. Bond and Cash ETFs accounted for 28% of all ETF inflows over the past year (up from 16%).
The trend of established fund managers launching new ‘active’ ETFs also continued. Some of these products have attracted significant funds from investors, but the performance of actively managed products is mixed.
Lastly, Currency and Commodity ETFs remain niche exposures for investors, with the fall in Currency ETF FUM due to ~$200m of outflows.
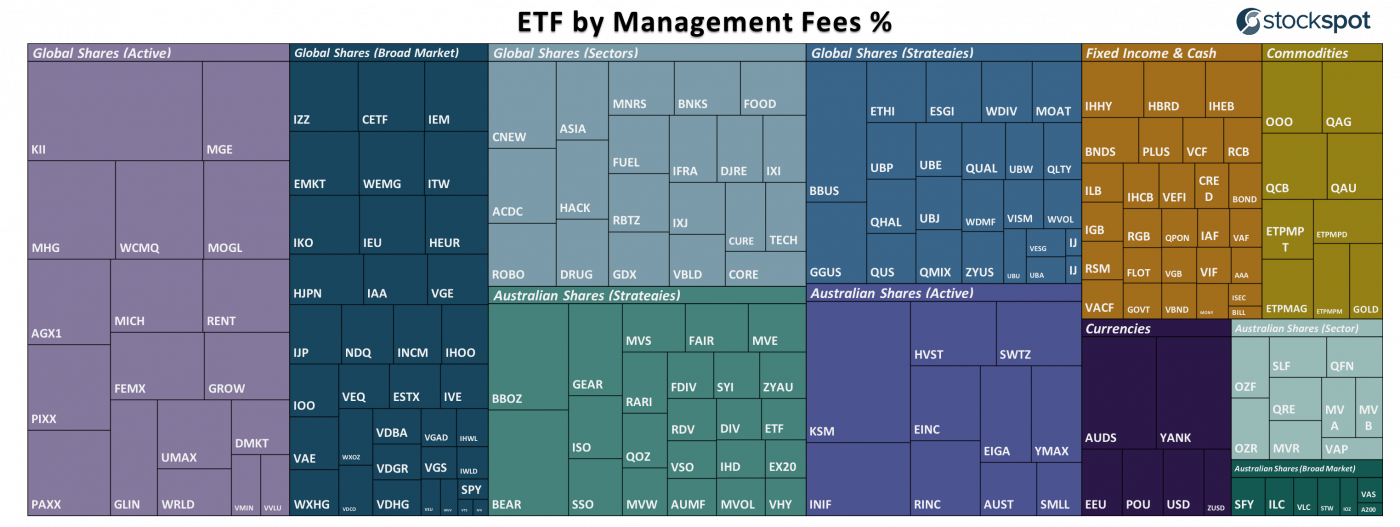
| Sector | # Products | FUM ($m) Mar’19 | Annual Change in FUM ($m) | Annual % change in FUM |
| Global Shares (broad market) | 36 | 14,298 | 2,549 | 22% |
| Australian Shares (broad market) | 7 | 9,649 | 1,484 | 18% |
| Fixed Income & Cash | 29 | 6,360 | 2,020 | 47% |
| Australian Shares (strategies) | 23 | 4,134 | 794 | 24% |
| Global Shares (active) | 18 | 2,684 | 880 | 49% |
| Global Shares (strategies) | 24 | 2,252 | 815 | 57% |
| Australia Shares (sectors) | 9 | 2,392 | 392 | 20% |
| Global Shares (sectors) | 20 | ,846 | 544 | 42% |
| Commodity | 10 | 1,021 | 128 | 14% |
| Currency | 6 | 393 | (148) | -27% |
| Australian Shares (active) | 10 | 743 | 2 | 0% |
| Totals | 192 | 45,774 | 9,641 | 26% |

Find out how Stockspot makes it easy to grow your wealth and invest in your future.